
Manitoba Mineral Analytical Facility
Mission Statement
The Manitoba Mineral Analytical Facility (MMAF) is focused on serving the environmental, exploration and mining sector in Canada and offers subsidies for companies working in Manitoba. Our mission is to aide in creating sustainable economic development in Manitoba, as we move away from a higher emission past to a cleaner and more renewable sourced future. Critical metals and minerals are vital, and we seek to be leaders in providing quality technical services for this imperative. We collaborate with industry, academia and government in working towards a prosperous and sustainable future for all.
Primary Services
The MMAF conducts in depth rock and mineral analyses, ranging from sample preparation and petrographic reporting to detailed mineral phase and ore characterization.
-
1. Petrographic reporting and rock characterization:
This involves making a polished thin section from a rock sample and then analyzing it using transmitted and reflected optical microscopy. This results in qualitative descriptions of texture, minerals present, alteration, metamorphism and estimated modal percentages of each mineral. This is commonly combined with scanning electron microscopy (SEM) and X-Ray diffraction (XRD) to increase confidence and provide quantitative results. This will facilitate rock classification, mineral identification and degree of metamorphism and hydrothermal alteration etc.

Back-scattered electron images with superimposed elemental maps highlighting the different phases in this rock. Gold grains are observed as inclusions in pyrite as well as in micro-fractures and along grain boundaries.
-
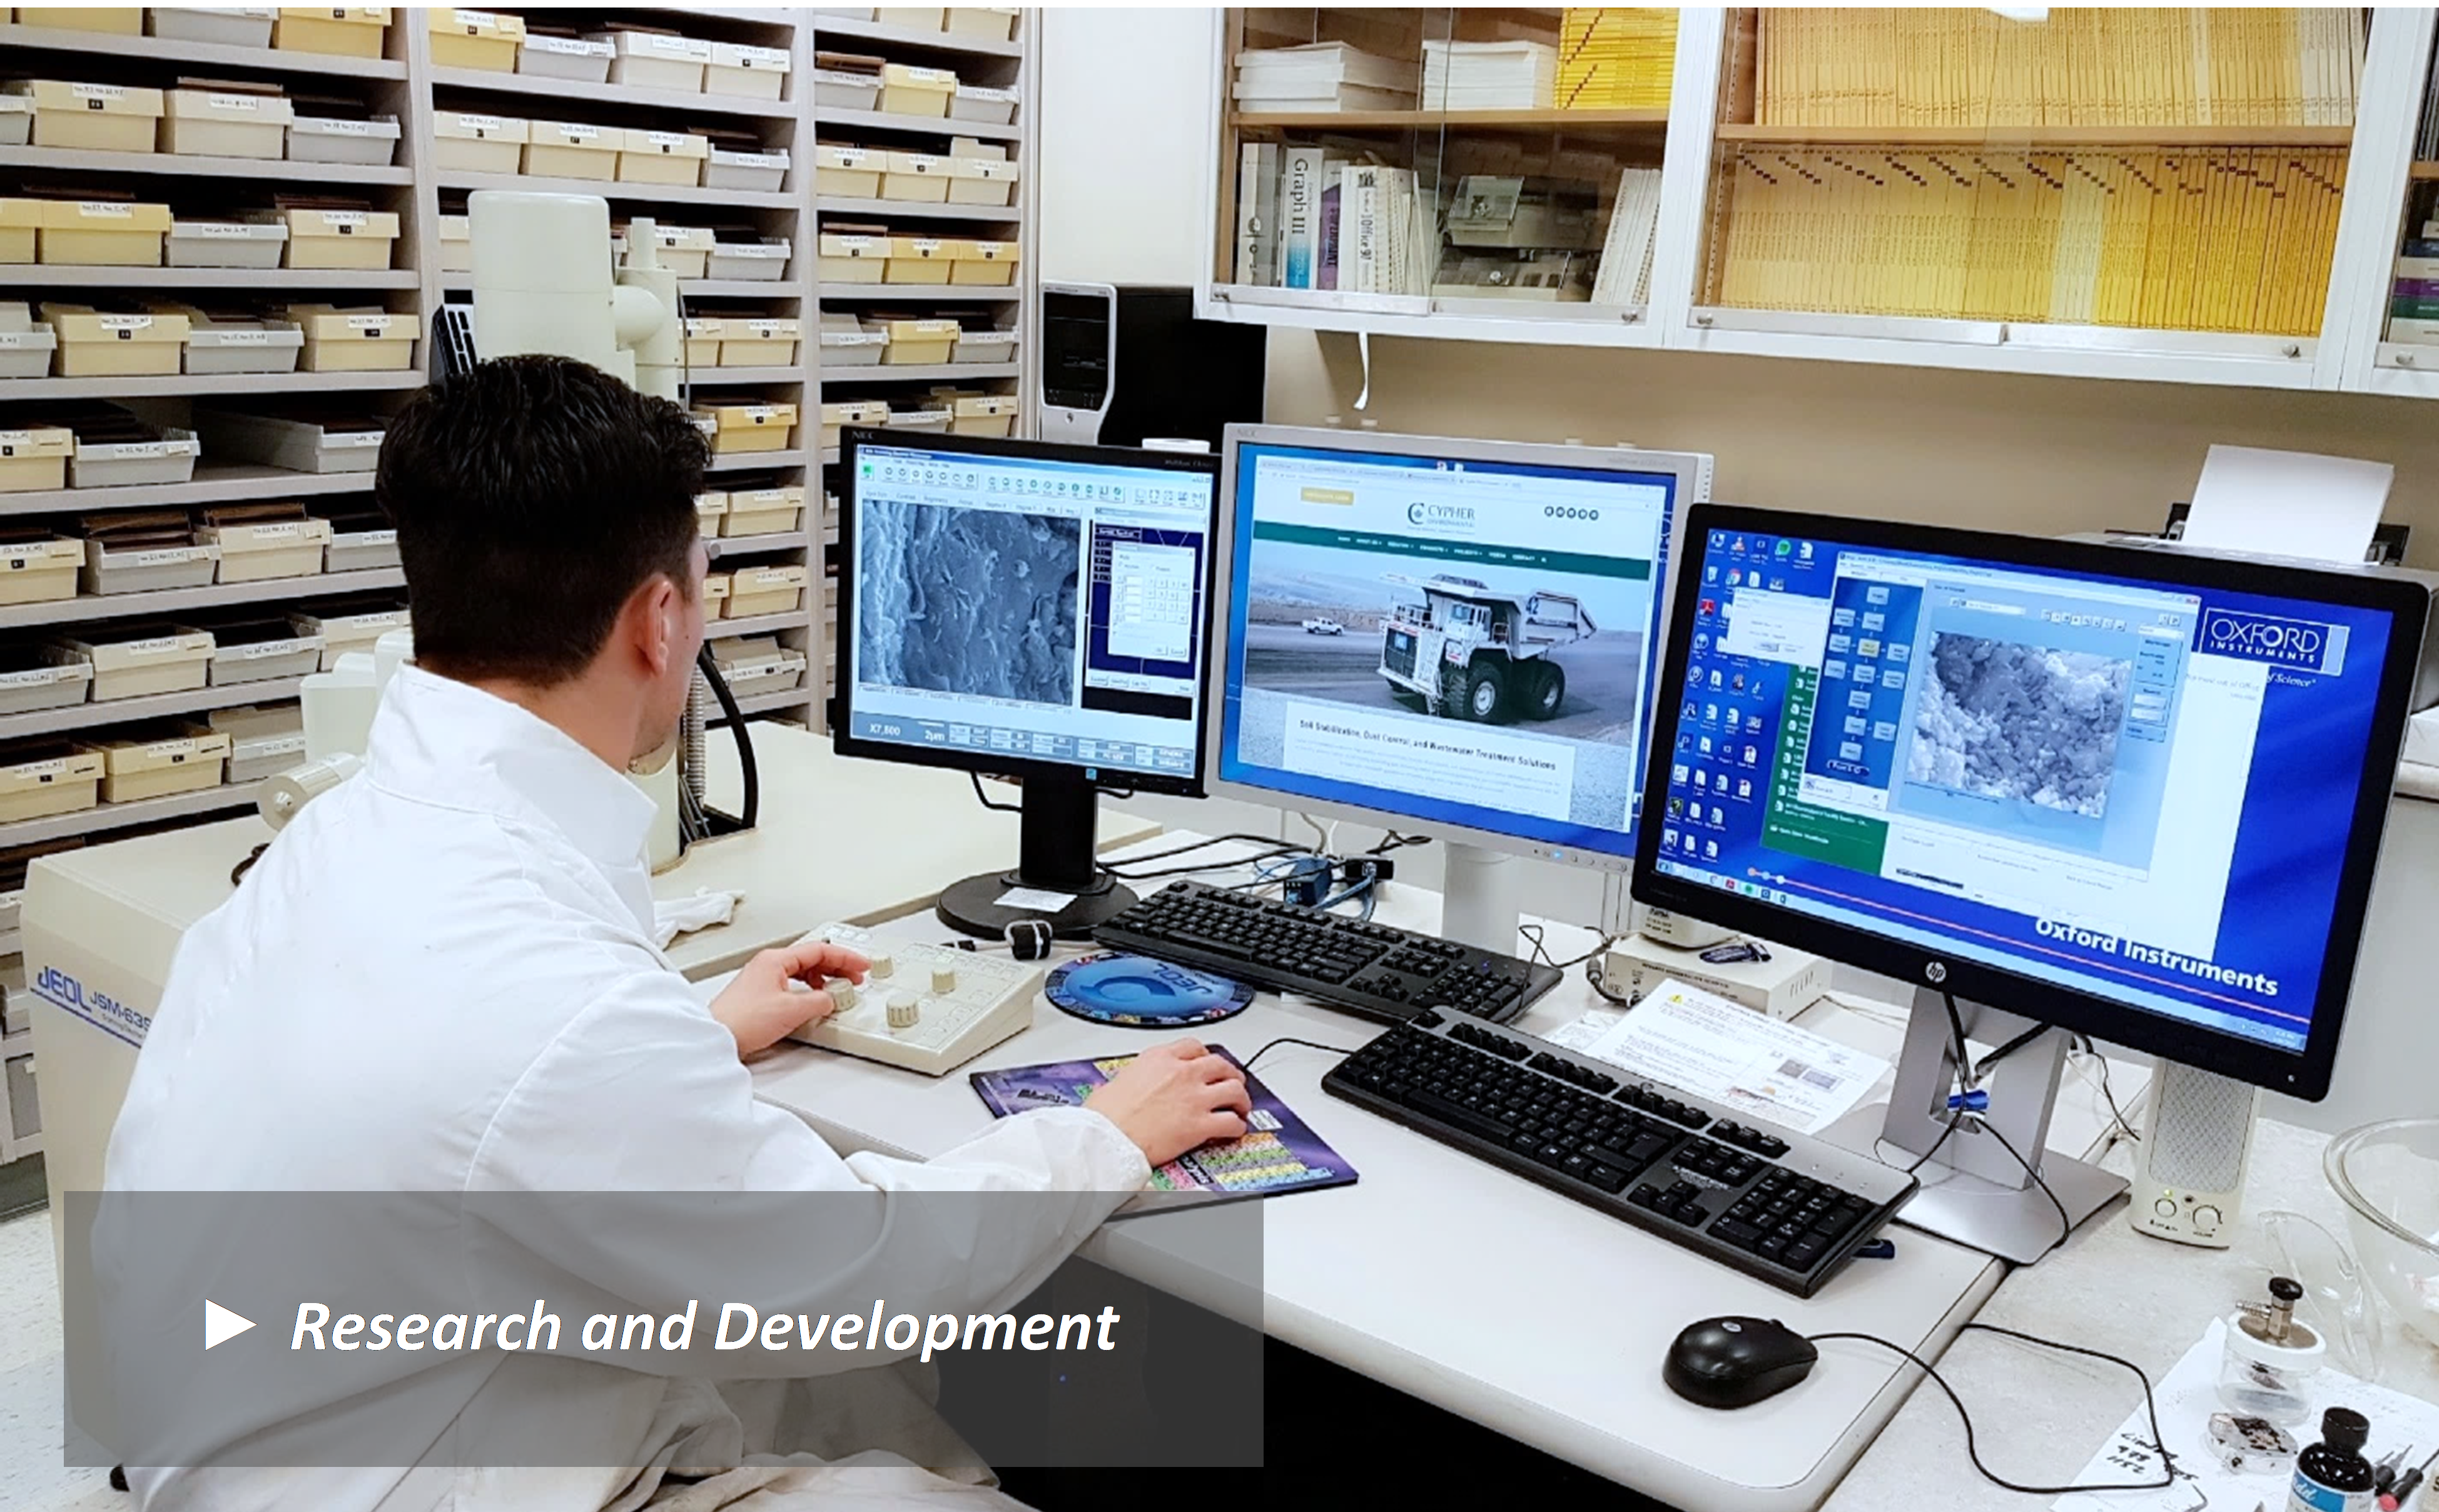
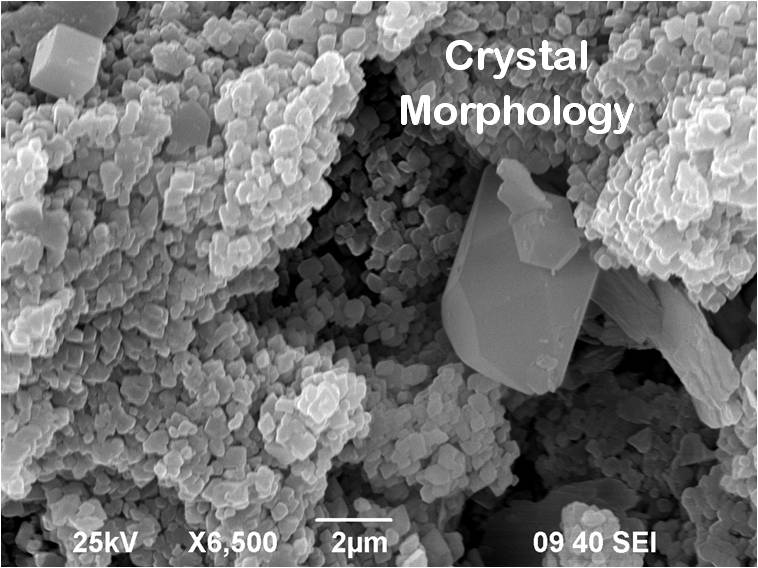
2. High magnification Imaging:
High resolution scanning electron microscopy micro textural and mineral information such as precious metal citing, micro-veins, mineral association and any minute changes that may occur due to differing external stimuli, environments, or treatments. 3D imaging at high magnification provides essential information for many applications.
-
3. Detailed Ore Characterization:
This is an automated process that uses scanning electron microscopy (SEM) energy dispersive spectroscopy (EDS) and the latest analytical software from Oxford Instruments to scan thin sections for precious metals and ore minerals, analyzing and documenting each occurrence. This results in thorough quantitative information regarding your mineralization including: morphology, grain size, composition, and mineral/metal associations. This may be done at any stage, from exploration to processing, aiding in optimizing recoveries and overall efficiencies. This is a must for geometallurigical studies and understanding your ore.
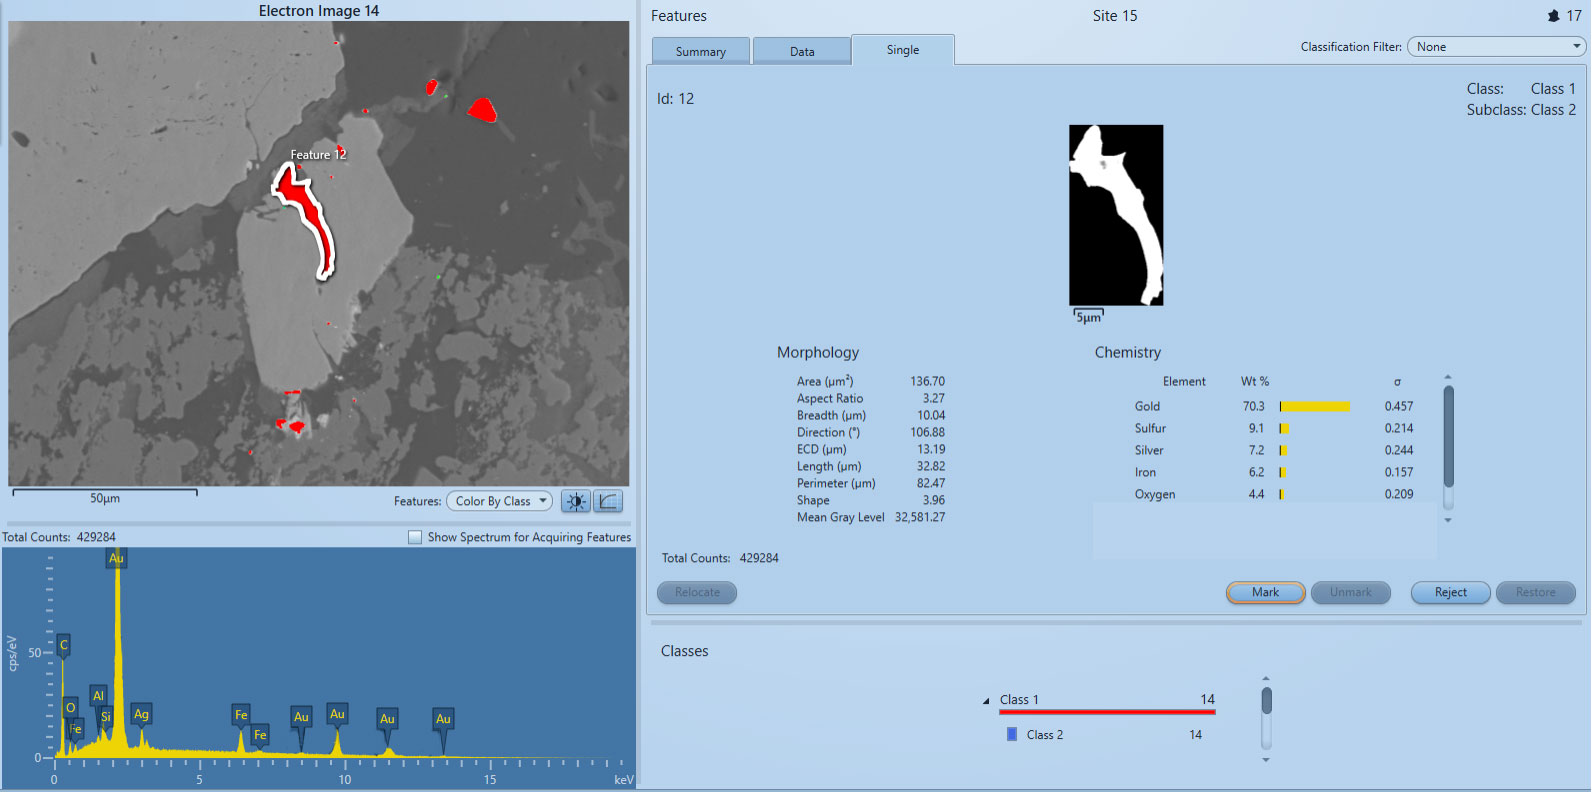
Back-scattered electron image showing gold grains in red (A), highlighted gold grain spectrum (B), and morphological and compositional information for highlighted grain (C). Automated feature analysis scans samples for precious metal phases and details chemistry, morphology, occurrence and association.
-
4. Systematic XRD analyses on drill core:
This is carried out in order to give a systematic reliable semi-quantitative to quantitative index for identification of the rocks and minerals present in drill core and other samples. The resultant data is much more reliable than core logs alone, which can be subjective and vary from logger to logger. XRD data is used to improve core logging accuracy, precision and correlation between logs and drill holes. Generally, it is recommended that this be carried out every 10 meters, however this may differ slightly from place to place and the variability of your rocks. This data may be used to extrapolate hardness and rock quality, or in combination with hardness tests and assay results, deduce a good estimate of rock behavior. Further it identifies and quantifies neutralizing and acid generating minerals so you may use this data to classify your rock as potential acid generating (PAG) or non-acid generating (NAG). It may be used to provide metallurgists with an idea of what deleterious elements or minerals are present in your ore. This information is not only essential to geologists and metallurgists, but also blast engineers, environmental reps, mine engineers, etc.
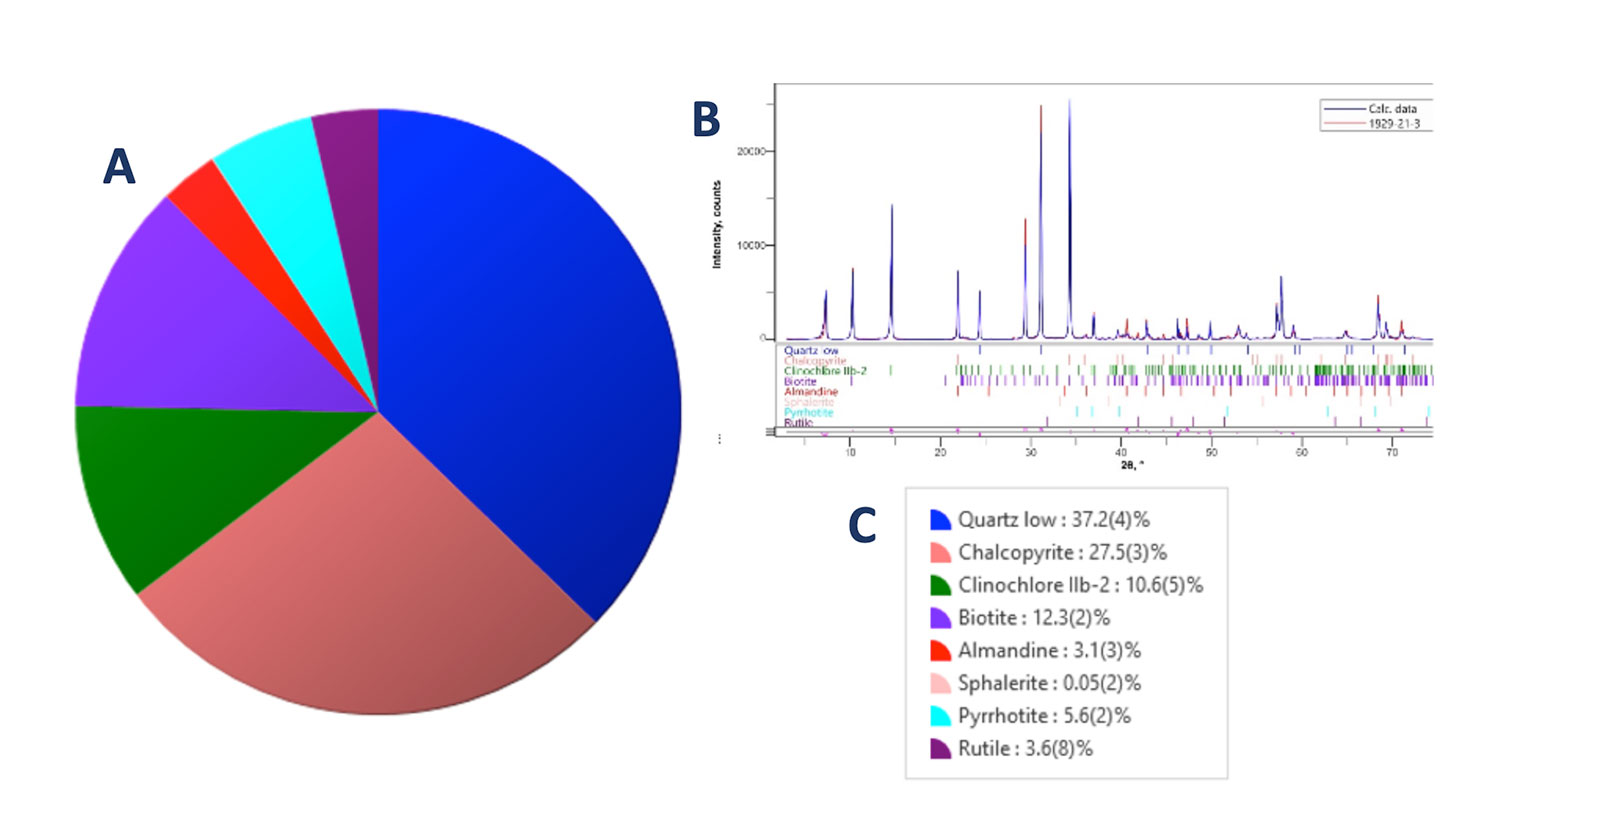
XRD: Pie chart (A) and diffractogram (B) displaying XRD results for a sample. Quantitative values (C) obtained from Rietveld refinement using Whole Powder Pattern Fitting (WPPF) method.
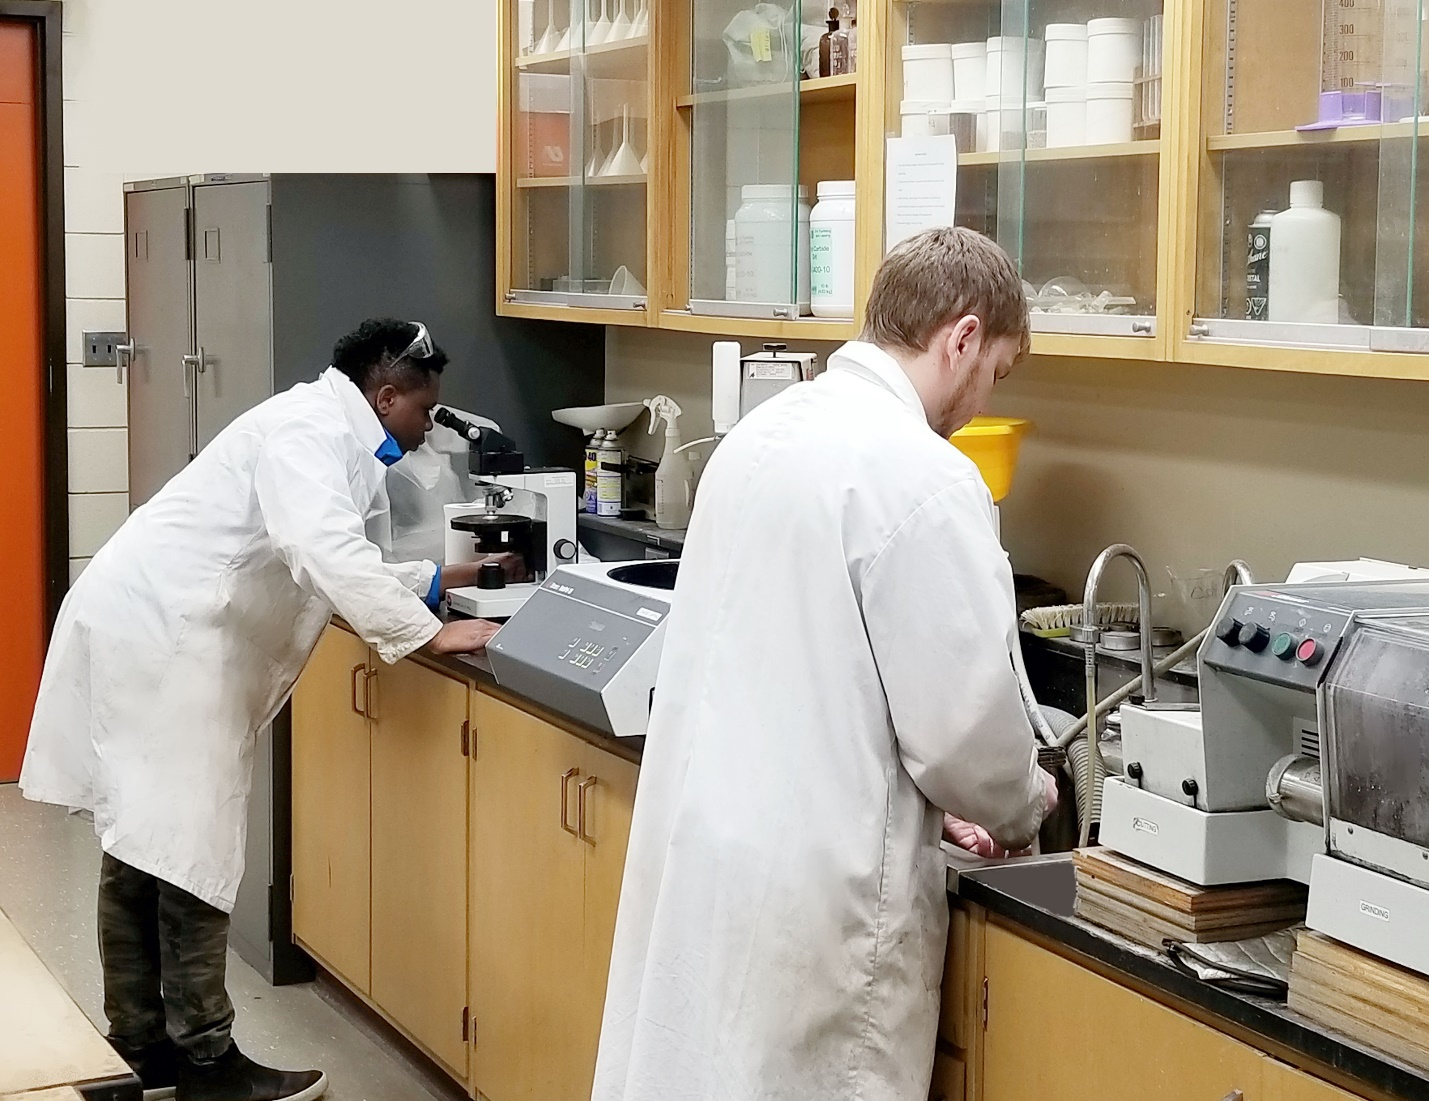
Roy and Kirill preparing polished thin-sections in one of the lapidary laboratories.
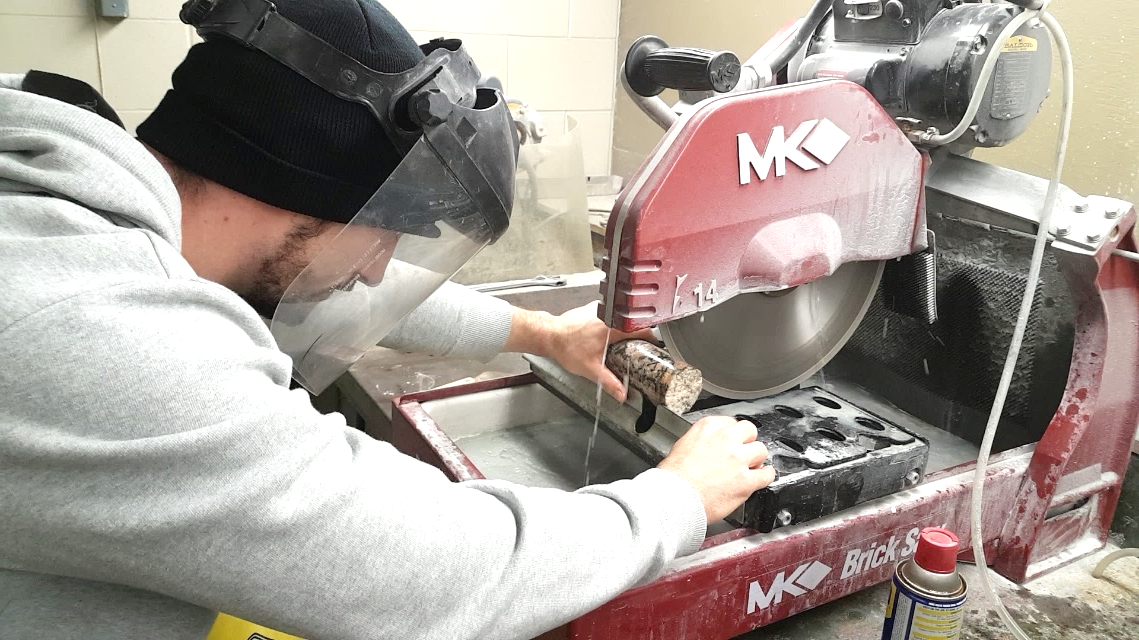
Gideon cutting drill core samples which will be powdered and analyzed using X-ray diffraction for mineral identification, concentrations and rock classification.
Primary Applications
Mine Development and Exploration
- Characterization of rocks and minerals
- Early indicators of mineral recoveries
- Assessment of diamond indicator minerals
- Geometallurgical mapping of ore bodies
- Research and Development
Mineral Processing and Metallurgy
- Mineral liberation studies
- Determination of mineral associations and liberation parameters
- Calculation of mineralogical grade-recovery curves
- Mineralogical balances for precious minerals
- Characterize metallurgical products from smelting, refining and hydrometallurgy
Mining and the Environment
- Characterization of mine tailings, waste rock, slags, leach residues and sludges
- Speciation and distribution of heavy metals
- Identification and quantification of acid generating and neutralizing minerals
At Brandon University we realize that individual needs may vary from client to client and we encourage you to contact us to discuss your specific project and analytical requirements.